Let’s play a little game to start, shall we?
When you think of a good quality, cheap chocolate bar – what comes to mind?
A Cherry Ripe? A Polly Waffle? A Cadbury Dairy Milk?
What if you need to get a quick bite of lunch on the go; where do you stop?
Subway? Grill’d? Nando’s?
Those three chocolate bars and three fast-food chains are at the top in their categories among hungry Aussies.
Our buying habits and their brand positioning have placed them at the top of the pile. So, choosing any of those three when asked about a quick bite or sweet treat puts you in very good company.
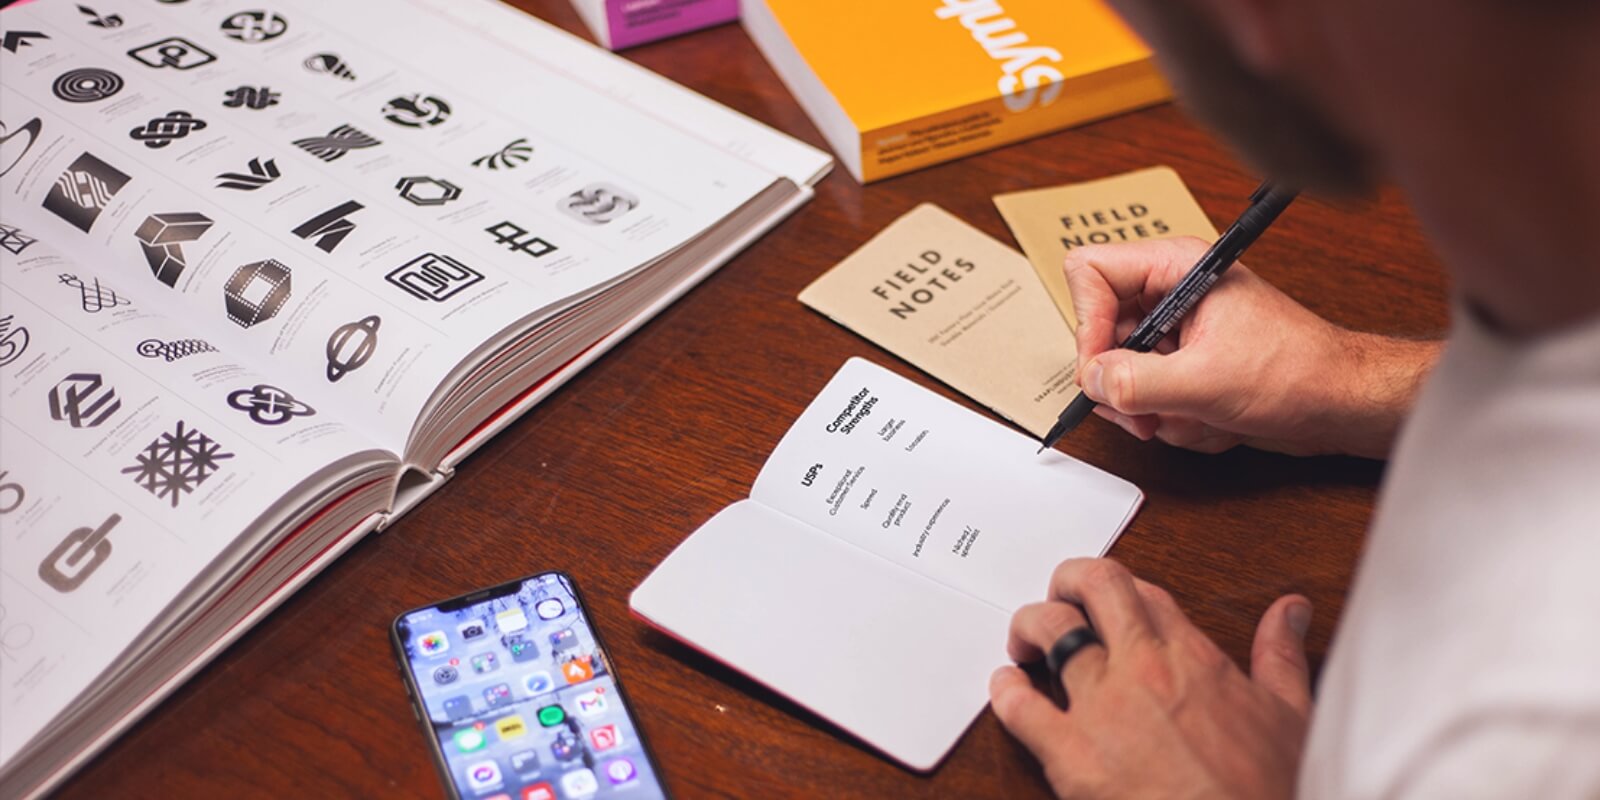
Do you know where your business stands with your customers? How do your customers view you, your brand, your product or service? What’s your market positioning?
We marketers use a handy tool to find out just those very metrics to help you market your business better.
This tool is called a perceptual map (or a positioning map). It maps perceptual ideas customers have about a brand or product.
Today, we’re going to examine the perceptual map in detail.
Let’s begin.
What Is a Perceptual Map?
When determining a new product, pricing out an existing product or devising how to market a product or service – you may feel the need to be a mind reader. Or worse yet, like you’re on a journey without a map guiding you to your destination.
What do your customers think? How do they really feel? What are the perceptions of customers about your brand?
One thing that can help in this domain is perceptual mapping (or positioning mapping).
Called perceptual maps or positioning maps, these visual representations of those very consumer perceptions are vital to your marketing efforts.
Simple Perceptual Maps
A perceptual map in its simplest form is an X-Y axis graph that shows how customers view a brand in comparison to the competition.
The two dimensions (X and Y) on a perceptual map represent two factors – preferably the most important – that potential customers use when determining whether or not to buy. Each axis is given two opposing attributes of the given factor, one on each end.
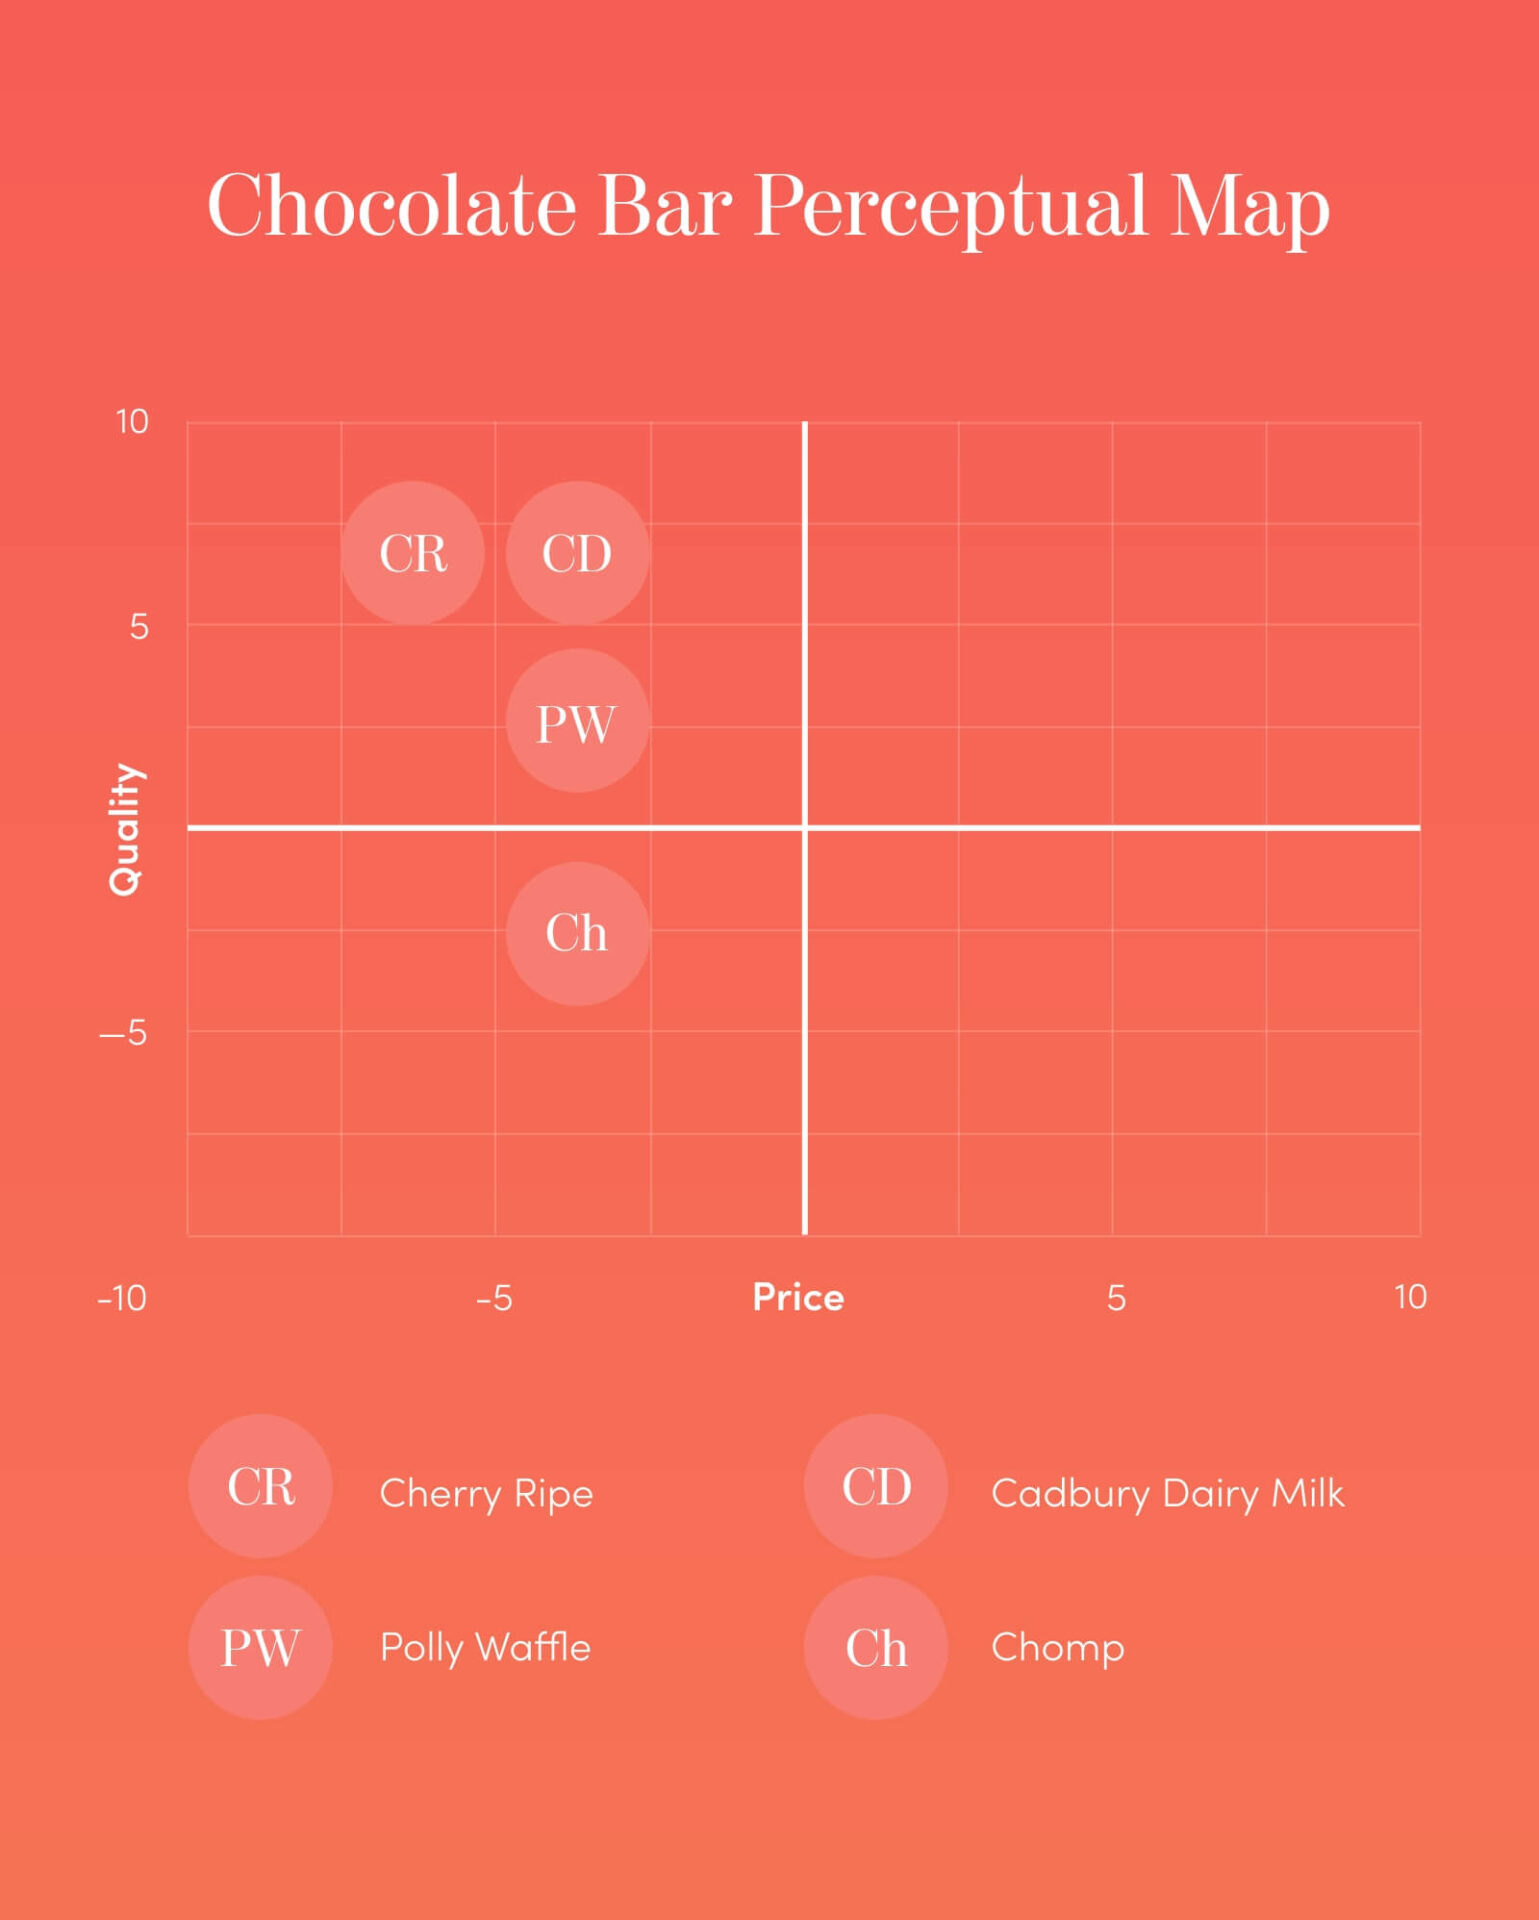
In the case of our candy bars, we can make a perceptual map with the price on one axis and quality of chocolate on the other.
Our top 3 are placed in the low price, high-quality quadrant, and the critic who claims no one over 10 would eat a Chomp bar would place that option in the low price, low-quality quadrant.
And that’s how perceptual maps work.
You gather data from various customers and possible future customers and score it on your graph. Where your brand falls can be considered a true perception of how customers see your brand.
Our Very Own Example Perceptual Map
Reading a Simple Perceptual Map
Above we have our chocolate bars, all mapped out for you in a perceptual map.
Our top three are clustered together at the top of the perceptual map, while poor old Chomp bars are in the bottom quadrant all by themselves.
And now we understand perceptual maps and perceptual mapping in a nutshell. Or in a candy bar wrapper, in keeping with the theme.
More Complex Perceptual Mapping
Let’s say you want to find out how your product stacks up against competing products in more than just two factors. You’ll need a more complex form of perceptual mapping.
Take a look at the perceptual map below. It lists several brands of over the counter pain relievers.
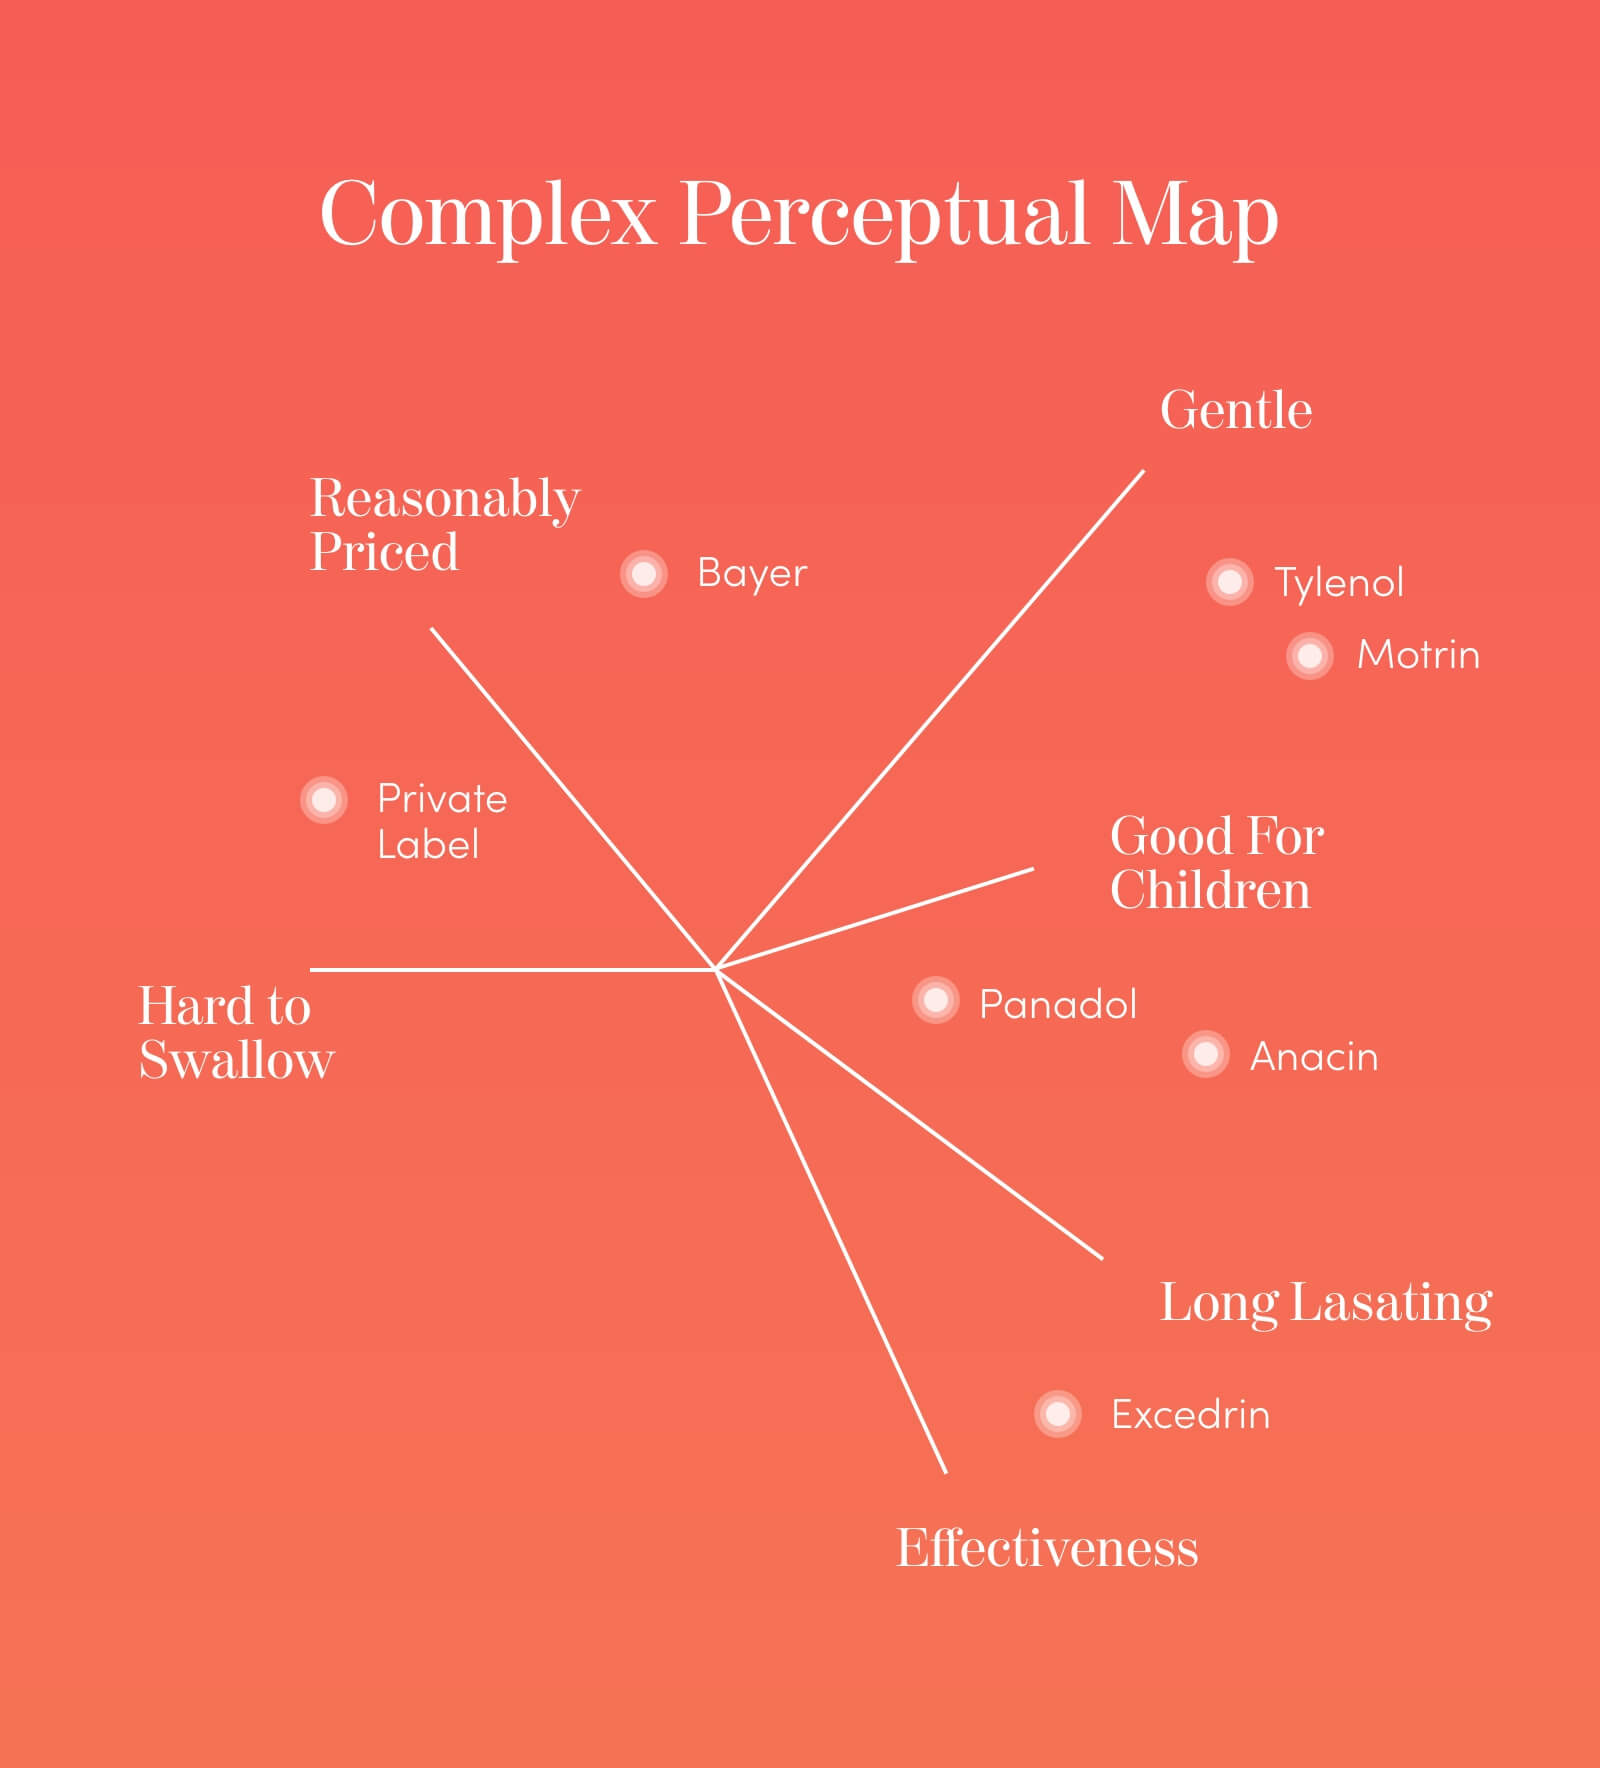
The makers of this example perceptual map wanted to gauge customer thoughts and feelings about 6 different aspects of the products.
The multi-dimensional aspect of this example perceptual map allows for all of that data to be visualised.
Why Perceptual Maps Are So Important
Qualitative Data to Show Subjective Perceptions
At its heart, a perceptual map gives you a qualitative, real-life look at your consumers’ subjective thoughts and feelings. How they perceive your brand and others is not something you can ordinarily gauge without perceptual mapping.
Real-Time Competitive Research
It would take a great deal of time and effort, and often money, to get the kind of competitive research a perceptual or positioning map offers. You can actually see how your product is perceived by potential buyers and why they may or may not be purchasing from you.
Your positioning in the marketplace becomes obvious and easily visualised.
Quantitative Data Visualised
We’ve focused on the qualitative nature of perceptual maps because that’s how they are most commonly used. You can, however, use positioning maps for quantitative data, too.
Let’s say you want to determine how well your product holds up over time vs. your competitors’ products when used with two different frequencies. You can create a positioning map using real data.
First, ask how often consumers use their Gadget 2000. Then, how long they’ve had it. Go to SuperGadget’s customers and ask the same questions. Create your perceptual map from the resulting data.
Your X axis demonstrates the frequency of use. Your Y axis records the length of ownership. You can easily see just how your product compares to SuperGadget, along with any other competitors of interest.
How to Create Your Own Perceptual Map
To map the perceptual ideas buyers have about your product or service, there are a few simple steps to follow:
- Decide which factors you want to learn more about.
- Construct a survey with questions that will get you the data you need.
- Distribute the survey to your customers.
- Collect the surveys.
- Record the data.
- Construct your perceptual map.
Deciding on Your Factors
Ultimately, your goal will determine the factors you use and the type of perceptual map you create. Want to know why consumers aren’t buying your product? Ask about price, quality and customer service.
Want to develop a new product or improve an old one? Ask why they don’t use your product or how they perceive your product being used.
And don’t forget that you don’t have to stick with just two factors. As our example perceptual map shows above, you can choose as many as you need.
Creating Your Survey
The better the questions you ask, the more detailed your data will be. Their responses will help you create a more comprehensive and accurate perceptual map.
Create your survey using a customer satisfaction template. You are, after all, asking about their good or bad ideas, along with their satisfaction with your products and competing products.
Distributing Your Survey
Brick and mortar operation? Hand out the survey. Include it in the bag with their purchase.
Online? Attach it to their receipt email.
Collect the Surveys
One of the hardest things to do is to get customers to take action after a sale. The best way to get your surveys answered is to offer an incentive. Give them a coupon or discount code when they return their survey.
Record the Data
Use a spreadsheet and document their responses. It’s the simplest way to record your data.
Construct Your Perceptual Maps
There are multiple graph makers available online; some are even free (we used one to create the example perceptual map for our chocolate bars). Anything from a professional, print-ready PDF to a simple perceptual map like we’ve used here is possible.
Use Perceptual Maps in Your Marketing
There are many ways to use perceptual maps in your marketing:
- Identify possibilities for new products
- Get a true idea of how your brand is perceived
- Track how your brand’s perception changes
- Record competitor positioning and changes in response to their marketing
- Identify possible marketing tactics for different market segments
- Determine your brand’s centrality vs. its uniqueness
- Identify possibilities for brand repositioning
A perceptual map can give you all that data and insight into your positioning in the marketplace.
Perceptual Maps and Brand Identity
Here at Red Kite Design, brand identity is a big deal. Using a perceptual map helps you get a true and insightful picture of just how your customers view your brand and its products. Along with your brand identity as a whole.
Think for a moment. Everyone recognizes the Subway colours – green, white and yellow. They represent fresh, healthy food. Cadbury’s distinctive dark purple wrappers suggest richness, comfort and quality.
Wouldn’t it be something if your brand became just as recognisable? Just as central and yet unique in your marketplace’s positioning?
We can help with that. Contact us today for a free quote or for more information.